Mapping Our Oceanic Impact
Interview with
Kimberly - We tried to gather as many global scale, high-resolution datasets that covered any type of human activity that influences the marine ecosystem. We tried to put it all together in a single format that we could compare them all and lay them on top of each other and see what the global impact is on the oceans.
Meera - How many impacts did you look at?
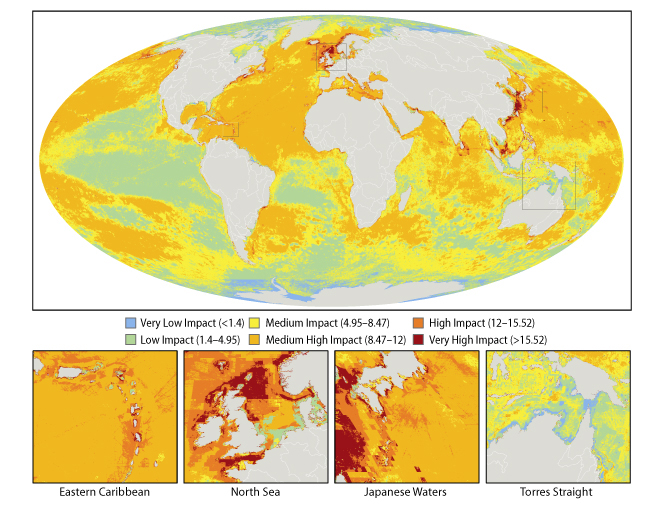 Kimberly - In total we found 17 datasets. We had an original list of 34 different stressors that result from human activities and half of these did not have any global scale data on them. We don't know where these things are going on. For seventeen we did find suitable data.
Meera - Of those 17 did you find out which ones had the most impact?
Kimberly - Yes, we always have to come up with a way to rank. The way that we used had to do with their impact. In that case sea temperature rise was having the largest impact in the most areas of the ocean. That means there are areas that have greater impacts locally.
Meera - How about fishing because that's usually quite a big cause?
Kimberly - It is a big cause. We divided fishing into five different commercial categories and also artisinal fishing. We didn't look at the six categories as a sum, we only looked at them individually. Individually they did not have such a large effect compared to the climate change effects.
Meera - So you've put all this stuff together but what did that show on the map? What areas were the most effective?
Kimberly - There was a large area off of the East China Sea and the South China Sea. Also the northern part of the North Sea stretching into the north Atlantic.
Meera - What are the main impacts, do you think, affecting those areas?
Kimberly - The sea temperature rise was very great in, for instance, the North Sea area. Also there were many types of fishing and very heavy shipping. Shipping had a major impact that we were surprised by in our model. Even compared to fishing.
Meera - Now you've got this map and you've got this information what do you want to do with it? What are the aims of the map?
Kimberly - There are a lot of different things that could be done. It's really a tool to be used by scientists to answer new questions about the spatial patterns that we have generated by human activities in the oceans. It can be used by educators to spread the word about how badly impacted the oceans are. We also see specific uses for policy makers in order to figure out who needs to coordinate to solve some of these problems of multiple uses that are having large impacts.
Meera - What kinds of effects are these impacts having on the marine ecosystem? What's happening to the life there?
Kimberly - The general impact is that it's affecting biodiversity. It's affecting how nutrients are cycled. In the worst-case scenario when there are too many activities for too long an ecosystem can entirely collapse. That means it just shifts into a different state altogether where the species change, the diversity is low. The nutrients cycle in a new way. Often in a way that's not as useful for a human society.
Meera - If this map helps people realise the different impacts having these effects would it be possible to reverse?
Kimberly - Yeah, I think one of the hopeful things about our project is that it provides for the first time a map of where different activities are happening and with that information we can make smarter decisions about how to manage our oceans. We can continue using the oceans and hopefully in a way that will maximise the benefit while minimising the impact.
- Previous Studying Corals
- Next Female Hormones Feminising Fish



Comments
Add a comment