In this week's atmospheric Naked Scientists, we're putting the air that we breathe under the microscope. We find out how air quality is monitored, how new technology could help you plan the least polluted walk to work and why seaweed might be responsible for making it rain! Also, we find out why dolphins spit for their dinner, how every cloud may have a lead lining and how the pesky mosquito's inspired a portable artificial pancreas. Plus, we get the low-down on the latest pandemic candidate - swine flu.
In this episode
Mosquito-inspired bloodsucker paves way towards artificial pancreas
A new high-tech gadget inspired by the humble mosquito could one day provide diabetic patients with a portable, artificial pancreas that will painlessly monitor and control their blood sugar levels.
The Electronic Mosquito, or e-mosquito, was invented and patented by Martin Mintchev and Karen Kaler, electrical engineers from the University of Calgary in Canada.
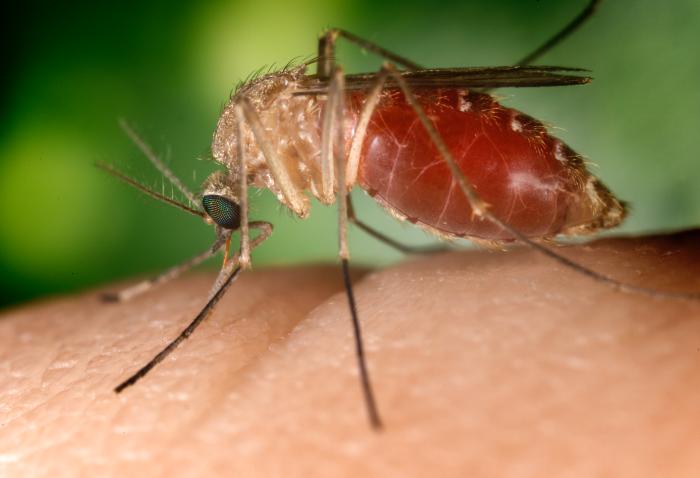 Modelled on the piercing, sucking mouthparts of mosquitoes, the e-mosquito device is currently about the size of a deck of cards and contains four micro-needles, which are about twice the diameter of a human hair. By carefully controlling the movement of the needles, they can delicately penetrate the skin just far enough to draw blood from shallow capillaries while avoiding nerves that are deeper in the skin, so the patient does not feel a thing.
The needles draw a tiny drop of blood - less than a millilitre - but that is enough for a lab-on-a-chip sensor in the device to measure blood sugar levels. It then sends the information wirelessly to a computer or a monitoring instrument worn on the wrist. It could be hooked up to an alarm to warn the patient or doctor that blood sugar levels are reaching dangerous levels.
Mintchev and Kaler now hope to start working towards making the gadget much smaller, until perhaps it resembles a regular sticking plaster or band-aid, and then diabetic patients would be able to monitor their blood sugar painlessly and effortlessly throughout the day.
The idea is eventually to link the e-mosquito to a device that can administer insulin - that vital hormone that diabetics lack which regulates blood sugar levels - and essentially create an artificial pancreas that not only monitors the amount of glucose in the blood but also automatically delivers the correct dose of insulin. The e-mosquito could soon offer hope to some of the 246 million people worldwide who suffer from diabetes and for whom needles and painful, time-consuming blood tests are still part of every day life.
Every cloud has a silver lining, or should that be a lead lining?
We could have inadvertently stalled the greenhouse effect by historically including lead in petrol, a European and US team of scientists have concluded.
Writing in the current edition of Nature Geosciences, Ulrike Lohmann and her colleagues show that lead is one of the most potent water droplet-forming agents in the atmosphere.
Clouds form when rising warm wet air expands sufficiently to cool, allowing water molecules to coalesce. At very low temperatures they can do this spontaneously but usually this occurs at much higher temperatures because the water molecules begin to cluster around particles of dust, pollen and even dandruff and bacteria. These particles are collectively known as nucleation sites, and lead is the king.
The team made the discovery by sampling clouds collected in Switzerland and also by recreating clouds in the laboratory using ambient air samples. When they fed their cloud samples into an analyser they found that the majority of the water droplets were associated with lead particles. Presumably the chemistry of lead makes it an ideal rain-maker, but the implication of the research is that by choosing to lubricate the valves of engines by adding lead to petrol we may have made a significant different to global weather and global warming.
The lead particles, say the scientists, could have triggered increased cloud formation by boosting the effectiveness of nucleating particles in the air. And because clouds reflect heat back out into space, this could have kept the Earth artifically cool despite rising CO2 levels. The effect, say the researchers, could have been sufficient to send back out to space nearly 1W per square metre that would otherwise have hit the ground and warmed the Earth. But now that we've eschewed lead in favour of a healthier atmosphere we may be about to reap the costs of the CO2 seeds we've sown in the past...

Down Under Dolphins spit for their dinner
Spitting at the dinner table may be the height of bad manners for us humans, but in the dolphin world it is quite acceptable.
 Researchers from the World Wide Fund for Nature, (WWF) have recently discovered that rare snubfin dolphins from down under get together in groups and spit for their dinner.
The snubfin is a strange-looking dolphin, at around 6 feet long, with a melon-shaped head and short stubby fins. Very little is known about this rare species, the only endemic dolphin species in Australia, which was discovered in 2005; until then the Australian populations were thought to belong to another species, the Irrawaddy dolphin, which lives in rivers of southeast Asia.
Now scientists have begun to unpick some of the secrets of these mysterious dolphins, and have seen them hunting in groups of 6 or more. Working together, some dolphins will chase fish towards the sea surface and then herd them towards other dolphins by spitting out jets of water from their mouths. Sometimes they shoot out plumes of water high into the air and other times will spit straight ahead just above the sea surface.
Sadly just as scientists are beginning to uncover more about their bizarre lives, the snubfin dolphins are coming under increasing pressure and are extremely threatened by coastal development and pollution. WWF are especially worried about plans to extend the port in Townsville on Australia's northeast coast, an important part of the snubfins' range. As well as the construction of dams and dredging of estuaries, the dolphins also face wider issues of climate change and sea levels rise.
10:36 - Swine Flu
Swine Flu
with Dr Paul Digard, Cambridge University
Chris Smith - Well also this week, worrying news about what is going on in Mexico. We have seen the emergence of a former flu H1N1 but it is not the former flu H1N1 that we normally see seasonally in humans. This form seems to be a swine, a pig form of the virus. So far there have been a thousand reported cases and maybe as many as 50 deaths and it doesn't just seem to be confined to Mexico because cases have also now been reported in a number of US states, including the adjacent California, also Kansas now and also maybe even New York.
So we are looking to see exactly what's going on and joining us is from Cambridge University, internationally renowned flu researcher Paul Digard, who is going to hopefully shed some light on this.
Paul Digard - Good evening.
Chris Smith - Welcome to the Naked Scientists. First of all, can you just explain for us actually what is swine flu, because we got our heads around bird flu as a risk, how does it compare, what is it?
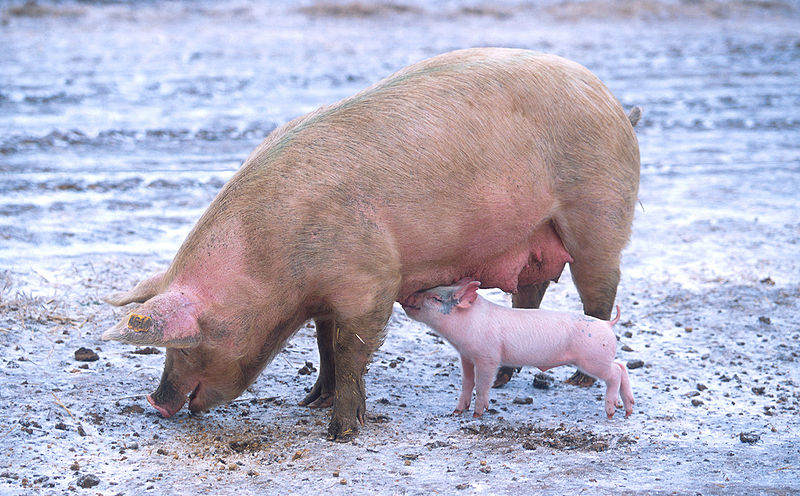 Paul Digard - Well swine flu is influenza A, same as human flu and bird flu but it's a form that's adapted to infect pigs. So history says that pigs had flu for at least last 100 years or so and when you look at the genetics of those strains, it's pretty clear that actually the viruses that infect pigs we have been swapping them backwards and forwards to in pigs and humans for quite a while.
Chris Smith - So in the same way that birds have their strain of flu which occasionally jumps into us, pigs have their strain of flu which occasionally jumps into us and vice versa. It is a giant sort of genetic melting pot and on this occasion this strain we are seeing in Mexico is a pig virus that has jumped out of the pigs and into the local population?
Paul Digard - Probably, the virus that's been found in people of Mexico and in the US genetically has some characteristics of swine flu but that's not the same as known that has come directly out of pigs into people, we don't really know where it's come from yet.
Chris Smith - So speculating for a minute, just talking about the mechanisms as to how it could have arrived, how could it have got out of the pig and enter a person in terms of to arrive at this sort of genetic situation we see with this virus now?
Paul Digard - Well, it's speculation because I don't know, I don't know if anybody knows what has actually happened in Mexico but the usual route is as people work in the pig industry, the pork industry, they have close contact with pigs. That's the start of transmission from animal to man and vice versa.
Chris Smith - So someone who is a worker, goes to work and comes into contact with a pig, the pig gives that person a pig virus directly, what about the other way round if the person gives their human flu to the pig?
Paul Digard - Same situation in influenza in pigs is very similar clinically to human influenza, it's a respiratory disease. The pigs have respiratory distress. They run on temperature. The virus is probably transmitted by most the same route, by aerosol perhaps fur mites, just general close contact will get the virus from one organism to another.
Chris Smith - So if a pig has got it's own form of flu at the same time as human form of flu then infects the pig, is it possible the pig got out like sort of mixing pot and you get out of that a hybrid virus which combines the worst bits of both?
Paul Digard - Yes, that's the theory. Pigs have been viewed as a mixing vessel for quite a while partly because we know that we can swap viruses backwards and forwards between pigs but even worse in the ways that pigs are also susceptible to quite a few strains of avian flu but when you look at the genetics of the viruses that you find in pigs it is pretty obvious that not only they are swapping genes between swine and human flu but they are also mixing an avian genes as well, avian virus genes.
Chris Smith - So is that why we should be more worried about a form of the virus that's come from a pig than just a normal human flu then?
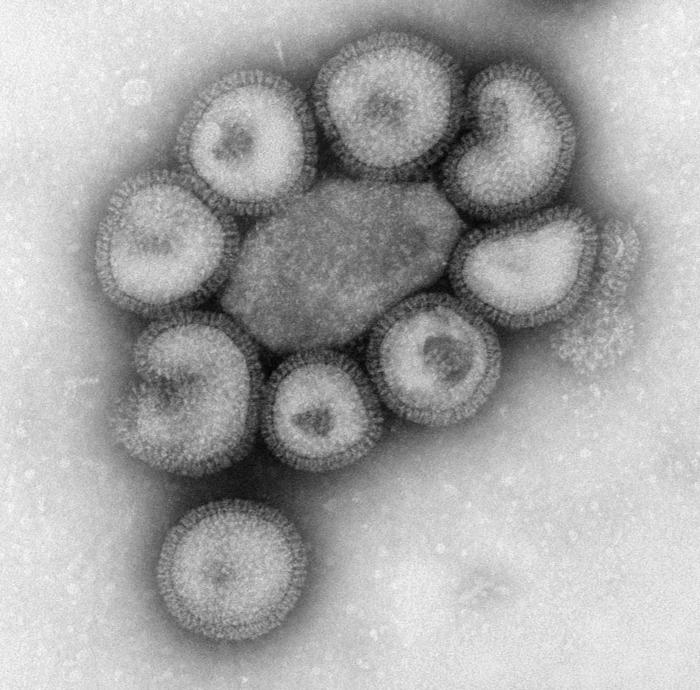 Paul Digard - What makes the current swine flu more dangerous is probably that it's antigenically novel for the human population.
Chris Smith - Meaning it looks total differently, we have never seen anything like this.
Paul Digard - So you and I and probably most people have heard, we'll have already have H1N1 flu but they will have the human strength and at the moment it is not at all clear whether that gives you any protection from infection with this swine H1N1.
Chris Smith - And the fact that you've got to catch flu the first time in some point in your life and most people don't die when they catch the flu, an appreciable number do but most don't, luckily, so why should this one be worse then? What's giving it the edge?
Paul Digard - Well we don't know that it is worse and what we know so far is there's perhaps 60 deaths or so but we don't know how many people have been infected so we don't know what the mortality rate is and it could be no more virulent than current human flu, it's just there's a large number of infections that haven't been noticed because they have not been severe enough to the persons that go to a doctor.
Chris Smith - And based on what we know about the flu historically and the history has a habit of repeating itself we have had a number of pandemics over the years and most famous that we have got defined is the 1918 Spanish flu, estimated 20 to 40 million people died with that, how does this event fit with what we know about those previous pandemics?
Paul Digard - First of all, we don't know that this is going to be the next pandemic. I mean there's a real chance it could be but we don't know. It could just burn out, it could go nowhere, obviously that's what you'd hope. If it does turn pandemic then it's different to the 57 and 68, it would be different from 57 and 68 pandemics because it was those were hybrid viruses between an avian strain and a human strain. Genetically I don't think we can say that we have ever seen a pandemic starting from a pig virus before. The 1918 virus, we don't really know for sure where it came from, probably avian but it's hard to say because we don't know what the virus before was.
Chris Smith - But is there any reason why the next pandemic couldn't start with a pig?
Paul Digard - Oh no, no, in this I think there's a reasonable chance that in a year's time we'll look back and think yes, this was the start of the 2009-2010 pandemic.
Chris Smith - Lets hope not, thank you very much Paul. That was Paul Digard who is a flu virologist at Cambridge University.
17:28 - Checking City Air
Checking City Air
with Jo Dicks, Cambridge City Council, air quality monitoring
Helen Scales - This week we are looking at the things that you might find in the atmosphere and later on we will be joined by Steven Ashworth who is using lasers to look at the chemicals above the ocean and find out how these contribute to environmental chemistry. But first Ben Valsler met up with Jo Dicks. He is a Scientific Officer for Cambridge City Council, to find out how they currently monitor the air we breathe in urban environments.
Ben Valsler - Monitoring levels of environmental pollutants is vital, not just for scientists to understand what's going on in our atmosphere but also for everybody that walks past the bus station, anybody that wants to build a new building, everybody who thinks that we need a new car park - and so I had met up with Jo Dicks, he is the Principal Scientific Officer for Cambridge City Council, outside one of their monitoring stations. So Jo, what do we have here?
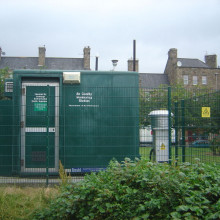
Jo Dicks - Well here we have two units measuring PM-10, which is small particles, and oxides of nitrogen both of which are in this location predominantly vehicle pollutants and we are quite close to the bus station and this is actually the site at which we measure the worst pollution in Cambridge currently.
Ben Valsler - Well we can certainly hear lots of buses going past us and we're next to a huge green box, how does this actually work?
Jo Dicks - Well this particular monitor draws air in through a filter which separates out the smaller particles. It then collects the dust on a filter which is on the end of a glass tube which vibrates at one frequency, as dust is deposited on that tube the frequency changes and that's what the device actually measures.
Ben Valsler - So the change in the frequency of this vibration will tell you what mass of particles you have that you are collecting from the air?
Jo Dicks - Absolutely, that's what it measures - mass and gives it in real time.
Ben Valsler - So this can measure the particulates that might be coming out of back of buses or various other sources, what else do we measure here?
Jo Dicks - Well we measure oxides of nitrogen and NO2, nitrogen dioxide in particular is the one that we have a health based standard for. In Cambridge we actually have air collision management area because of high levels of NO2 which is only formed by combustion and principally it is formed by vehicle combustion in the city, that's the main source here.
Ben Valsler - So right here we have the one measuring center, are there more of these across the city?
Jo Dicks - Yes, we have got five locations like this, one is at our office which is part of a national network and four others fairly central.
Ben Valsler - So how do you actually collect the data for this? Does somebody have to come around and plug themselves in, or does it transmit back to you at the council?
Jo Dicks - No, we've got a modem link to all of these sites and it's actually collected by a contractor who then quality assures that data and sends it back to us. We do get a daily digest of the information but we also then get six monthly and annual ratified data sets.
Ben Valsler - How much does one of these cost to run?
Jo Dicks - Well, they cost about £50,000.00 in capital outlay to buy the whole set and then about three or four thousand pounds a year to service.
Ben Valsler - And this will give you a good measure around each and every one of these signs but obviously we'd like to know in a bit more detail about what might happen say to somebody walking through Cambridge town centre?
Jo Dicks - Absolutely, and we are very interested in people's actual personal exposure to air pollutants and a fixed site like this - whereas it gives you a good picture of what's going on at that particular location, it's very poor at showing what day-to-day exposure people actually get. You are then looking at someone's actual exposure, you are also seeing where the high points of exposure are and that could then dictate which route they take to avoid these peak areas.
 Ben Valsler - So once we have this sort of information, the information you are collecting from these base stations as well as potential information from somebody walking around with a handheld monitor, what can we use this for?
Jo Dicks - Well we can use it to inform planning decisions and also perhaps cycling, walking routes but also where we then monitor in the future - we wouldn't want to be putting a great deal of new housing into an area that's already got very poor air quality without mitigating that in some way and likewise you wouldn't want to be sending extra buses along a road that's already heavily polluted.
Ben Valsler - So if I was proposing building a new shopping centre somewhere around Cambridge City Centre, what would I have to do to make sure that you say it's okay to build it?
Jo Dicks - Well you would certainly be required to meet air quality assessment and that would involve monitoring the background levels prior to developments and then modeling the impact of the developments upon the air quality situation locally. At the moment we would ask for a small diffusion tubes survey to be carried out and to inform us of the background levels and that particular locality.
Ben Valsler - How do the diffusion tubes work?
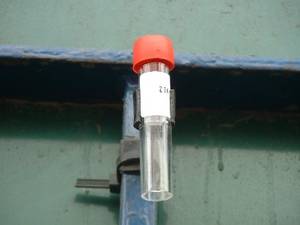
Jo Dicks - Well, a diffusion tube is just a very simple device, it has a small grid with a bit of reagent on it which we then hang on a lamp post, it absorbs pollutants, in this case nitrogen dioxide, over the period of exposure and then it get sent off to a lab to be analysed. So it gives us maybe one day to point a month or one day to point a fortnight depending on how often you change the tube.
Ben Valsler - So I have found the site that I want to build my shopping centre, I have put a series of these diffusion tubes around and I have given you three months worth of data showing how much nitrous oxide there is in the air, what next?
Jo Dicks - We would then ask the area to be modeled, I mean use this dispersion model and which is mathematical modeling but it requires validation with monitoring information so we run a model with the new traffic flows in place and use the diffusion tube data to validate that model. But diffusion tube data, it's very low resolution, it's not very accurate, you get sort of plus and minus 20% accuracy with this. So it's extremely ball-park and it's not very good for validating models. The devices that we have been working on recently would enable much greater data resolution, much greater accuracy temporal resolution and it would allow us to pinpoint the areas where the pollution would be worst.
Ben Valsler - And so with this higher resolution data you can far more accurately predict the impact that my new shopping centre would have?
Jo Dicks - Absolutely, and we are talking about very, very small changes which can make a great deal of difference.
Ben Valsler - So what do you see as the future of environmental monitoring?
Jo Dicks - Well obviously these fixed sites with very accurate reference methods are always going to be important. We have got 11 years' worth of continuous data from these sites in Cambridge which is a great wealth of information but a combination of much more mobile monitoring and a greater special array across the city undoubtedly form our decisions better in the future.
Helen Scales - That was Jo Dicks, Principal Scientific Officer for Cambridge Council explaining that although static environmental sensors give us constant high quality data of how clean our air is, they are rather expensive and they can only tell us about the air immediately around where they are placed.
Cambridge City Council put the latest information on air quality online - to check it out, go here: http://www.iosoft.co.uk/ccc/ccc.php
24:26 - Developing Mobile Environmental Monitors
Developing Mobile Environmental Monitors
with Prof. Rod Jones, Cambridge University
Chris Smith - Now Professor Rod Jones who is at Cambridge University, has been working with Cambridge Council to find a way to fill in these gaps and he has been developing cheap mobile environmental monitors to really show how much pollution each person could be exposed to.
Rod Jones - Well the big issue that we are really looking at is that we know that air quality can impact on human health on the one hand and actually on the radiative properties of the atmosphere and the bigger picture still I guess, is that we know that as we look into our future climate, we are likely to see changes in air quality.
 So what we are looking at is trying to understand some of the basic principles associated with what controls air quality and ultimately I guess how we might take steps to try and mitigate changes in the future.
Chris Smith - Air quality can be considered in two ways so there's the air quality on the scale of whole planet and then there's air quality just around town, so are you looking at everything or you're just looking at one small component there?
Rod Jones - Well so our work actually looks at the global issues but this particular project is much more focused on local air quality. So it's the kind of air that we breathe in cities and in urban environments.
Chris Smith - And when a person takes a walk down the road in the average city, what sorts of things they are being exposed to?
Rod Jones - Well a range of gases, things like nitrogen oxides, ozone of course, particulates and the main gases which I think are causing people concern.
Chris Smith - So how are you going to start with them?
Rod Jones - Well of course that probably is being studied at some level but a lot of the equipment that's needed to study, it is big, expensive and complex to run and so you can only locate measurements of that kind in rather sparse network and so what we are trying to do is to look on a much smaller scale, on the meters and more than that we are trying to introduce sensors which we can carry around in our pockets to monitor how air quality is changing and how the air we breathe is changing actually as we walk the streets.
Chris Smith - Because that's going to be a much more realistic measure, isn't it, because if you just sample one area, if the traffic isn't in that area or the wind's blowing the other way you are going to miss a lot of stuff, people don't stay on one place, they move around.
Rod Jones - That's right, and there's a certain amount of evidence that even which side of the street you are on when determining to some extent the exposure to pollutants that you are going to have.
Chris Smith - So what's the strategy? What have you got to do this with?
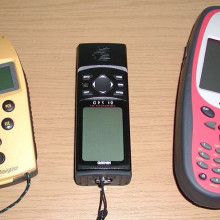
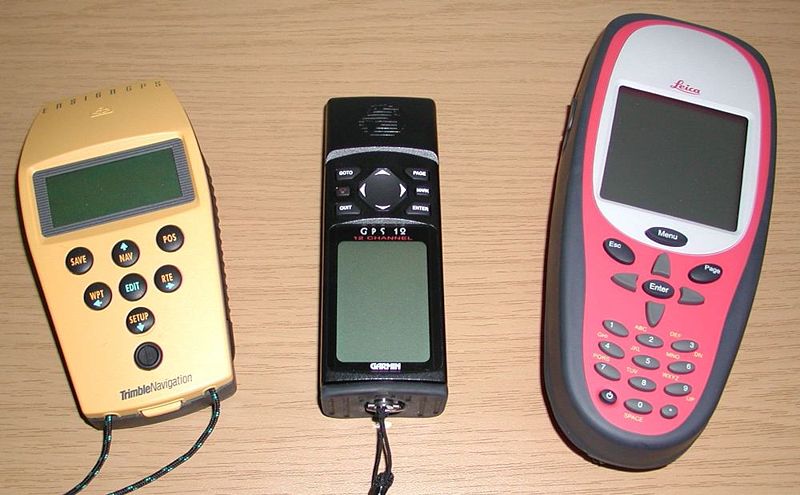
Rod Jones - Well, nobody has adapted really. Our sensors which are actually used for monitoring of dangerous gases and they are very small sensors in themselves so they are very amenable to being put into very small packages and so we've basically got a handheld device which weighs perhaps 200 gms which actually has on board GPS which we are all used to using in our cars for the location and in fact the guts of a mobile phone which is turned GPRS which allows us to transmit the data from these little boxes to a central computer in real time.
So in fact what we can do is to give people who are involved with the projects, these sensors to carry in their pockets and on to the streets and we can actually map the pollution that they are being exposed to and in fact others around them are being exposed to, in real time.
 Chris Smith - And how do you then put all that data together? How does the system actually work to compile real time data and link it geography?
Rod Jones - Well of course the GPS tells you where you are and we can then map the pollutants that we saw the pollutant levels that we see on to even simple things like Google Earth and so that you can see precisely where the high levels or low levels of pollutants are. Of course it's never that simple because as you said a moment ago, standing on one point the pollution varies quite widely but we are able to, at least to some level to pick up that as well.
Chris Smith - How are you actually getting data yet or you're just at the stage where you have got prototypes of the devices now it's ready to go out in teams of people to see what the pollution looks like?
Rod Jones - That stage that we are at is that we actually have a pretty advanced prototype sensors which include, as I said, the GPS, GPRS or the communications on location and we have them in sufficient numbers that we can actually pretty much inundate a city. Where we are not quite there yet is in the sophisticated analysis software that you need both to analyse the data from a scientific perspective and to produce something which somebody can log on to the web and actually see in a web page what the pollution for a particular time of day or what they might be expected to be exposed to if they lived in a particular part of a city, is, and we are working very rapidly on that. So we are hoping to put together the whole package but it's not quite the finished article yet.
Chris Smith - How are you going to use it? Is this going to be giving pedestrian these devices? Is it going to be cars these devices because obviously they are going to see different levels of pollution and what sort of resolution you are able to get because can you literally see someone walking on a pavement versus someone in the car or on the road?
Rod Jones - Some of the sensors are certainly capable of detecting those, that the differences between being in the centre of the road and being on the pavement but I think really what we are aiming for here is to produce a network of sensors which solve, which will be static in fact but any kind of platform, moving platform as well as lamp post, for example, would be used to provide us with a very wide range of data for this very complicated environment and where you can envisage somebody walking down the street with their mobile phone actually using WiFi or the Internet to pick up a map which gives you real time pollution.
Chris Smith - And that was going to be where I was going to go next which is to ask you well how is this going to guide either re-planning of towns and cities and traffic flow or how humans behave?
Rod Jones - Well there are ranges of activities which could be influenced by this. If you have a sophisticated network of air quality measurements then you can actually use that to begin to understand how that links into the detailed traffic flow and ultimately you could think about controlling traffic flow to minimize the hotspots, the pollution hotspots.
On another level you could actually use it to begin to map out if you like the lowest pollution path between your place of work and your house and so somebody in the morning can get up and look at the web and decide which is the preferred cycling route which is going to give them the least level of exposure to pollution, that's a dream for the future but it's not that far in the future.
Chris Smith - And do you think you'll see yourself one day in the position where you will be able to go up to the developer who is about to put in a new housing state and you would say 'Don't build your roads like that because we know that will create a greater pollution problem than if you plan like this'?
Rod Jones - Well I think we, in a sense, have a responsibility to try and answer those kinds of questions, how clear cut an answer you can get for some of the questions that you have just asked, I am not really sure yet but we are to be able to derive a general picture of how to, for example, build a housing estate in a green fashion.
Chris Smith - Indeed, and also get to work with the least inhaled aerosol pollutants, it sounds good news to me. That was professor Rod Jones, he is at Cambridge University's Chemistry Department who was explaining to me there how his handheld devices could make sure that new developments are brought in locations that would do the least environmental damage and also let people plan their healthiest commutes or even the cleanest walk to the shops.
32:08 - On the Road with Mobile Sensors
On the Road with Mobile Sensors
with Prof. Rod Jones & Dr Mark Calleja, Cambridge University
Helen - You are listening to The Naked Scientists with Chris Smith and me, Helen Scales and we have heard a lot about the portable sensors that Rod Jones and his team are using to monitor pollutant levels whilst walking around a city. So lets now join Meera to see how these sensors actually work in action.
Meera Senthilingam - Yes, so I am now here at the Chemistry Department at the University of Cambridge with Rod Jones and we've got one of these handheld devices in front of us and there's a lot packed in here so what have we got here, at the top we've got the three sensors, what are these sensors detecting?
 Rod Jones - Well the three that you can see here are detecting nitrogen dioxide, nitric oxide and carbon monoxide. Inside each sensor there's a small amount of fluid which is called the electrolyte and when the gases enter the sensors that actually forces very small current to flow in that electrolyte and you measure the current so you can relate the current from this which is very small, to the amount of gas that you are trying to detect, and of course this box does rather more than that then because what it has to do is to take that current and digitize it so that we can then transfer it to a computer.
These boxes actually also determine where we are using GPS that everybody knows, and in fact there's a blue tooth connection here which then links it to a mobile phone which is sitting just next with me now and it's that mobile phone which transmits the data from the sensor in real time to a central computer so that we can look at it.
Meera Senthilingam - Now you have managed to pack all of this into not only a light box but it's size is actually quite small, it's only about 15 cms by about 5 cms - and you are going to take me on a particular route around Cambridge so we can see these devices in action. Where are we going to go?
Rod Jones - Well we're going to go from the Chemistry Department which then enters immediately a busy road. We are gong to walk towards a major traffic junction and then into an area which is green park area really. These are typical of the kinds of places that we have been making these kinds of measurements.
Meera Senthilingam - We are outside the Chemistry Department now with the handheld monitor. Rod, how are you going to turn it on? What should we do before we start our walk?
Rod Jones - Well I have just turned the phone on and it now shows the screen which I can then use to detect the sensor box. On the sensor box I am just switching on that by pushing one single button and in a minute, there we are, it's telling us that the device is working and has actually detected the GPS satellites. So we are now ready to go.
Meera Senthilingam - Okay, so lets go. We are heading down towards a particularly busy junction. Now I can imagine that the sensor will be particularly active right now.
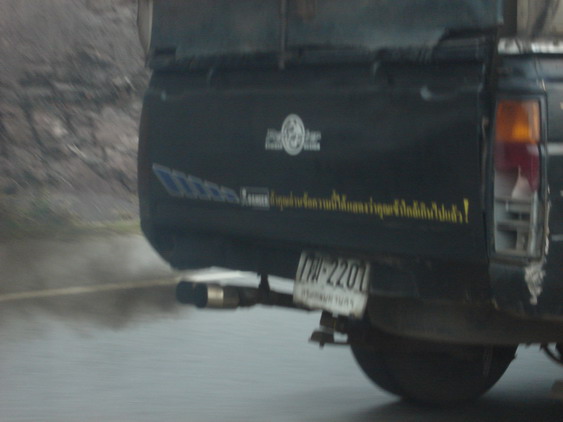
Rod Jones - Well yes, the chemistry of the atmosphere is really quite complex. A lot of these vehicles are going to be releasing a fair amount of nitric oxide and so we'd like to expect to see really quite high values of nitric oxide and of course individual cars have very different emission a month. So and the age of it already matters as well that if a vehicle is old and not particularly well maintained, it is quite likely that the emissions from that are going to be much higher.
Meera Senthilingam - It is very busy here. There are numerous cars, motorbikes, lorries, trucks just going by but now we are going to head over into the quite Parkers Piece.
Rod Jones - It's very interesting because if we are trying to understand how the chemistry of the troposphere works, we actually have to look at a lot of different sources and immediately you can see that we have trees and greenery here, all of which can emit a range of different molecules which can affect the chemistry of the troposphere. So we need to get the complete picture and this little box is part of that process.
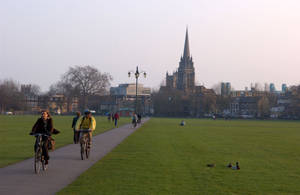 Meera Senthilingam - We are now in the middle of Parkers Piece, which is a very large green area here in Cambridge. Now it is much quieter, the cars are much further away but you know, they are still not that far so surely the pollutants are still going to be reasonably high here.
Rod Jones - That's right, and in fact we can feel a slight breeze, that's obviously going to bring the pollution from the road which we can see just over there into Parkers Piece. We are not likely to see quite as big fluctuations in the emissions from vehicles because they have now tended to mix out a little bit.
Meera Senthilingam - As pleasant and sunny as it is here we now are going to go back to the lab in order to look at the information of this particular ride.
We are now back on Rod Jones's lab in the Chemistry Department but joining me now is Mark Calleja who is a software developer on the project. So Mark, you've got your laptop with you here and it's got Google Earth on it so on your Google Earth now we've got a satellite view of the area that I just walked with Rod. What are you going to show me on this particular view of Cambridge?
Mark Calleja - Right, here we are going to have a time-dependent plot of someone walking around with a sensor and we are going to just show the nitrogen dioxide track and just to show the difference between walk inside the quiet street or next with a traffic laden street. We have colour-coded data points so those from dark blue low pollution to pale blue to white for medium levels of pollution, going up to pink and dark red means high levels of pollution.
Meera Senthilingam - So this particular video we are going to watch is just showing one person wandering around Cambridge, the person is shown on the map as a circle and the circle is moving around as the person is moving around Cambridge. Now to start with, this circle is dark blue which means that the pollution levels are actually quite low.
Mark Calleja - It so happened at that time yes it was. It's mainly dark blue for the routes this person has chosen except when he gets to quite a busy street which is just off Parkers Piece and then he starts going to pinks and reds. That's not unusual, wherever you get high levels of traffic that's when you expect your pollution levels to go high. As you can see as he go down to the bystreets the pollution levels drop.
Meera Senthilingam - But as you say, this is for a very specific moment of time. So how can you collate this information into something a bit more usable?
Mark Calleja - What we'll do is we can plot all data points from a time window on one graph and impose our graph on the relevant map from Google Earth and that will allow us to have a more fuller picture what happens over say a day or a week.
Meera Senthilingam - And Rod, actually you've got one of these graphs full of the particular route that we walked today. It is basically a series of lines around the city and it looks like a wall or something has been built around it and variations and the height of this wall are basically the variations in certain pollutants.
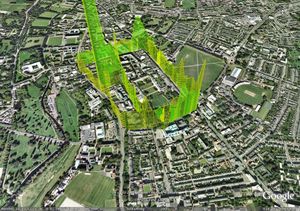 Rod Jones - Well that's right, as Mark was saying what we have done here is just a plot on top of the Google Map a vertical line which represents the amount of pollution at a particular point and so as an individual walks around the streets you can see a line which follows the mocking and the height of the line above the surface represents the amount of pollutant, in this case, carbon monoxide.
And here in Gonville Place that was the place that we stood with all the traffic flowing around, in fact we see the highest amount of carbon monoxide around two parts per million which is way, way above the natural background. But you can now see where these sensors really come into their own. So if we now look at our map of nitric oxide what we see in fact is really very high concentrations of NO, close to where the bus station is, but now when you follow our walk into the center of Parkers Piece, surprisingly the nitric oxide values drop really quite low.
What it means is that we are further away from the vehicles which are the primary nitric oxide sources but now if we look at NO2 which is one of I guess of considerable concern in terms of health, we certainly see that the NO2 values in the middle of Parkers Piece are in fact every bit as high as in the surrounding areas, and in the sense we expect that because what we are saying is the reaction of nitric oxide with ozone to give us NO2 and so the NO2 values kind of hold up as you move away from the direct pollution sources. 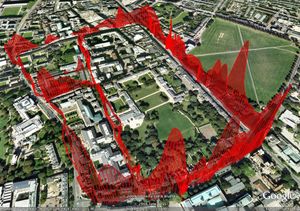
But everything actually depends critically on the subtleties, the wind speeds, the meteorology, the specific vehicle that passes you by.
Meera Senthilingam - What you are going to do with this information in the future? Could it be the case where someone could just log on and plan their route according to the levels of pollutants they see?
Rod Jones - Well that's one of the ambitions I think of this project so that anybody, anywhere can actually determine by looking at the web what their likely pollution exposure is going to be.
Helen Scales - So if this technology develops further you could have a clear picture of where pollutants are highest and therefore where to avoid not in your own city but many cities around the world. That was professor Rod Jones and Dr. Mark Calleja showing Meera Senthilingam just how these portable sensors work and how we can use the data with Google Earth to get a detailed map of local pollution.
40:36 - Seaweed Seeds Clouds
Seaweed Seeds Clouds
with Dr Stephen Ashworth, University of East Anglia
Chris Smith - So we have heard about the developments in monitoring pollution in enclosed urban environments but other systems also contribute to the quality of air across the country and Dr. Stephen Ashworth is in the University of East Anglia in Norfolk where he studies the gases that come from marine systems to find out how they contribute to the chemistry in the air around us and that means on the scope of the whole planet.
Stephen, hello, welcome to the Naked Scientists.
Stephen Ashworth - Hello.
Chris Smith - So what are the big questions you are trying to answer?
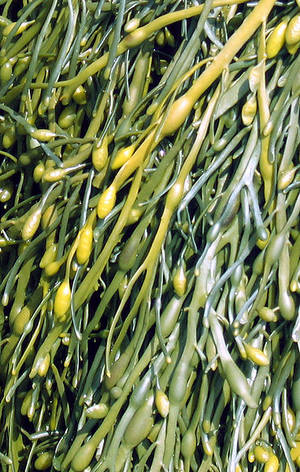 Stephen Ashworth - Well, this work came out of a campaign that goes ahead of Mayshead. We heard in a piece just a moment ago about the natural background levels and one thing that's very important for us atmospheric scientists to know is what those natural background levels are. Now one place this is done is at Mayshead in island and the idea behind that is the prevailing wind is from the Atlantic so there's very little pollution. So on days when it's blowing from the west we can get a very good idea of what natural background levels of various components of the atmosphere are.
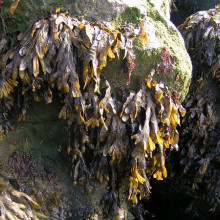
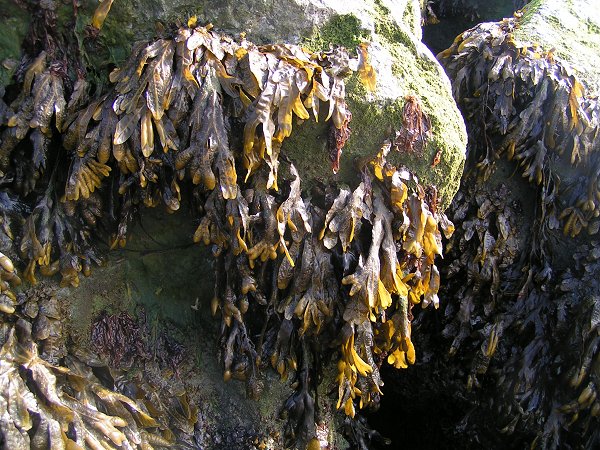
But one thing that came out of one of these campaigns was that there were very high levels of particles detected, these aerosols that we have been talking about and having detected these particles the question was what goes to make them up, and it turns out that these particles have a lot of iodine in them and the iodine was traced to the seaweed on the foreshore at Mayshead.
Now the question is then is this a local phenomenon or does it affect the whole globe?
Chris Smith - So what you are saying is that the iodine which is coming presumably from the sea, could be getting into the atmosphere in clouds and therefore triggering things like cloud formation and therefore influencing rainfall?
Stephen Ashworth - Exactly, certainly the seaweeds give off a lot of iodine in compounds and that iodine then gets processed by the atmosphere and turns up in these aerosol particles and they are just the sort of surfaces you were talking about right at the beginning that would enable water to condense and form clouds.
Chris Smith - How does the iodine get out of the seaweed and into the atmosphere?
Stephen Ashworth - Well, it seems that this is mechanism against stress. If the seaweed feels stressed it releases these compounds and one of the things that stresses seaweed is the tide going out so they tend to get dry and release compounds containing iodine.
Chris Smith - So that would then be blown up on the pervading wind into the atmosphere where it would then have downstream, excuse the water pun, effects on the weather.
Stephen Ashworth - Yes, exactly. The sun shines on these compounds, the light, it's the interaction with the light of the sun that causes the iodine to be broken off these compounds. It then turns out and reacts with ozone in the atmosphere to produce iodine oxides and there what go on to make up these, the particles.
Chris Smith - So how are you trying to understand more about this iodine and to understand more about the chemistry as to how it gets into the atmosphere and how much width there is?
Stephen Ashworth - Well the idea here is that we can measure in the atmosphere what's there. We want to answer the question how was it produced and what's it going on to make at a later date with interaction with other chemicals in the air, with sunlight and whatever. So we need to take things back to the laboratory and make these compounds under as controlled conditions as possible and analyse how fast they react, what they react with and what they turn into once they have reacted.
Chris Smith - And how are you doing that?
Stephen Ashworth - Well we can mimic this process by producing ozone in the sample cell and feeding in some iodine containing compounds. We can also mimic sunlight in the laboratory fairly well and we find that we make lots of particles. Another experiment that we have done is to actually try and break down the production of the particles into a series of steps and so that we build up the iodine oxides one step at a time.
We find to do this, these compounds don't absorb very much light. This is how we measure how much we have got and how fast it is reacting. We use a laser to see how much light is absorbed.
Chris Smith - All right, so you know the different chemicals absorb laser light at different wavelength so if you shine a laser beam of the right wavelength through it, the amount of laser light that get soaked up must be proportional to how much of the chemical is there.
Stephen Ashworth - That's exactly right but because we need a lot of chemical in this case to actually see the change in the laser light and we have to do a little trick by trapping the laser light between two mirrors and that makes it bounce up and down through our sample lots of times, and if we are lucky with the right combination of circumstances we can get effective lengths. So it makes it look as though the sample maybe 10 kms long.
 Chris Smith - Has anyone actually done this in terms of really shining a laser beam through 10 kms of atmosphere rather than bouncing it on a light path, 10 kms long between two mirrors like this?
Stephen Ashworth - There are experiments which do that, you can shine a laser beam 90 kms up into the atmosphere and get a signal back in an experiment called LIDAR but it's a slightly different principle that's involved there.
Chris Smith - But do the results agree? So you think you've got a good model with your mirror bouncing system to accurately predict this important aspect of atmospheric chemistry?
Stephen Ashworth - Okay, I misled you a bit there, the LIDAR results aren't actually used on the iodine chemistry but we believe through modeling - again we have heard earlier in the program about the various modeling that can be done - by modeling the systems using the results from the kinetics that we measure and how fast these reactions go and what's produced, we can be confident that we have a fairly good understanding of this system.
Chris Smith - Genius, thank you very much Stephen.
Stephen Ashworth - My pleasure.
Chris Smith - That was Dr. Stephen Ashworth who is from UEA, University of East Anglia working on ways to detect the chemicals that are important to climate and the earth's atmosphere.
48:37 - Do magnets remove limescale from water pipes?
Do magnets remove limescale from water pipes?
We put this to Dr Hugh Hunt, from Cambridge University's Engineering department...
I am Hugh Hunt from Cambridge University Engineering Department. Well, there are lots of manufacturer's websites that claim that if you put magnets on your water pipes then that prevents limescale build up on the element of your immersion heater.
Well it's obviously in the manufacturer's interest to make these claims, but let's suppose that, in the last year, a manufacturer has sold a thousand of these devices and they get one letter which says how fantastic it is, another ten letters that say that doesn't work. Well they can give ten refunds. They have still made quite a lot of money and they can publish that one nice letter.
That may be what we are seeing on the websites [selling these gadgets]; that's possibly being a bit mean, but I am a bit puzzled that there aren't any quoted refereed scientific publications out of the mainstream literature [supporting these claims].
Surely, if there was something really scientific going on here it would be well and truly understood. So I just wonder... Now there are few possible candidate theories all to do with magneto-hydrodynamics and water memory and things to do with nucleation and so on, you can read all about these.
But where does that leave us? Well I think if you have found that one of these devices works for you, well it doesn't do any harm so you may as well carry on using it. But if you find that it doesn't work then perhaps there's no surprise in that.
What's so good about electric cars?
Chris Smith - Well I think that Paul has a point which is that there's no such thing as a free lunch. If you are suing energy it's got to come from somewhere but the benefit in electric car offers is that it doesn't produce pollution once it's working as an electric car, obviously the pollution is all in one place, the power station, and that means that mitigating strategies to recover the waste from the power station, the CO2, the particles etc. can be done locally where the power station is and probably more effectively than fitting scrubbers and things which will be less efficient to a car and also individual cars are all going to be inherently less efficient than one giant power station.
So it's the sum of lots of little inefficiencies adding up to a bigger inefficiency, the one big inefficiency - the power station. So that's why we think electric cars are beneficial. They also are much better in traffic because stopping and starting burns enormous amounts of fuel waste, enormous amounts of energy. Electric motors are absolutely perfect for that kind of thing because they don't waste energy when they're not actually moving.
Will global warming raise water levels in rivers?
Helen Scales - Well what's going on in the rivers and streams and lakes and fresh water inland is a different process than in the seas because what they rely on mostly for the levels of them is the rain. It's all about whether it's going to rain more or less, and one of the things we really know about climate change and what's going to change in the future is that there's going to be a difference in how different areas respond, some will become drier, there will be less rain, and some will become wetter, there will be more and we are already seeing this and in some areas like Australia, we are seeing huge amounts of droughts, rivers are drying up and that's likely to become even more prevalent in some areas but there will be also rain increasing in some parts of the world.
So it would definitely vary and not be a sort of general increase in sea level that we will see and the sea levels are rising of course because actually as that huge amounts of water heats up it will expand and the sea levels will go up and also more water will pull into the oceans and from the melting icecaps and things like that. So really the picture in the rivers will be very regionally diverse and it would depend on where you are in the world.
Chris Smith - So, the bottom line is rivers occur owing to rain, and sea levels are going to rise anyway because of thermal expansion as well as ice melting...





Comments
Add a comment