What can microfossils tell us about past climate? Christopher Stanton resumes his story...
So, here I am with tea in hand, writing for the masses once again. I would like to start by apologising to the readers for taking such a long break, but I was engrossed in my Master’s Degree, which is now successfully completed. That makes me a Master of Geology, though I still feel as though I am far from it.
I digress. So I was asked to expand on my last article, which was about microfossils and what we might learn from them. In this article, I hope to show you what I found. I am going to break this article into two sections, Western Irish Lakes (Lough Corrib) and Eastern US Continental Shelf (Off the Outer Banks, North Carolina). Why you may wonder? I did two projects, so two sections. I promise, they overlap somewhat nicely.
So, lads and lasses, let us begin on the Emerald Isle. If you grab a map of Ireland (without the rest of the United Kingdom attached) you could look up and down the west coast until you found Lough Corrib. Here’s a hint, it’s just above Galway Bay. In fact, Lough Corrib empties into Galway Bay via a relatively small opening to the south. I was not able to go collect the two cores from Ireland myself unfortunately, but I had two cores, Corrib Core 2 and Hedford Core 2.
I was instructed on how to process each sample for ostracodes (little shrimp-like, shelled creatures). I took two different types of ostracodes from each sample for isotope testing, Limnocytherina and Metacypris. The reason for using two different ostracodes from the same sample was for something called "vital offset", or differing isotopic compositions of shells from different species in the same environment. Vital offset is sort of a quality control. The isotopic data should show the same trends, if not the same values.
I sat and drank tea while I waited for the isotopic results. Why tea? Well, I was up in Canada to do my research for isotopes, in the middle of January. The highest high was negative thirty. Did you know they have to plug in their cars overnight in the winter up there? Did you know any remaining moisture from the previous use blows out into the car when it starts? The blowing crystals have a really nice snow globe effect. It also serves as a reminder that it is COLD.
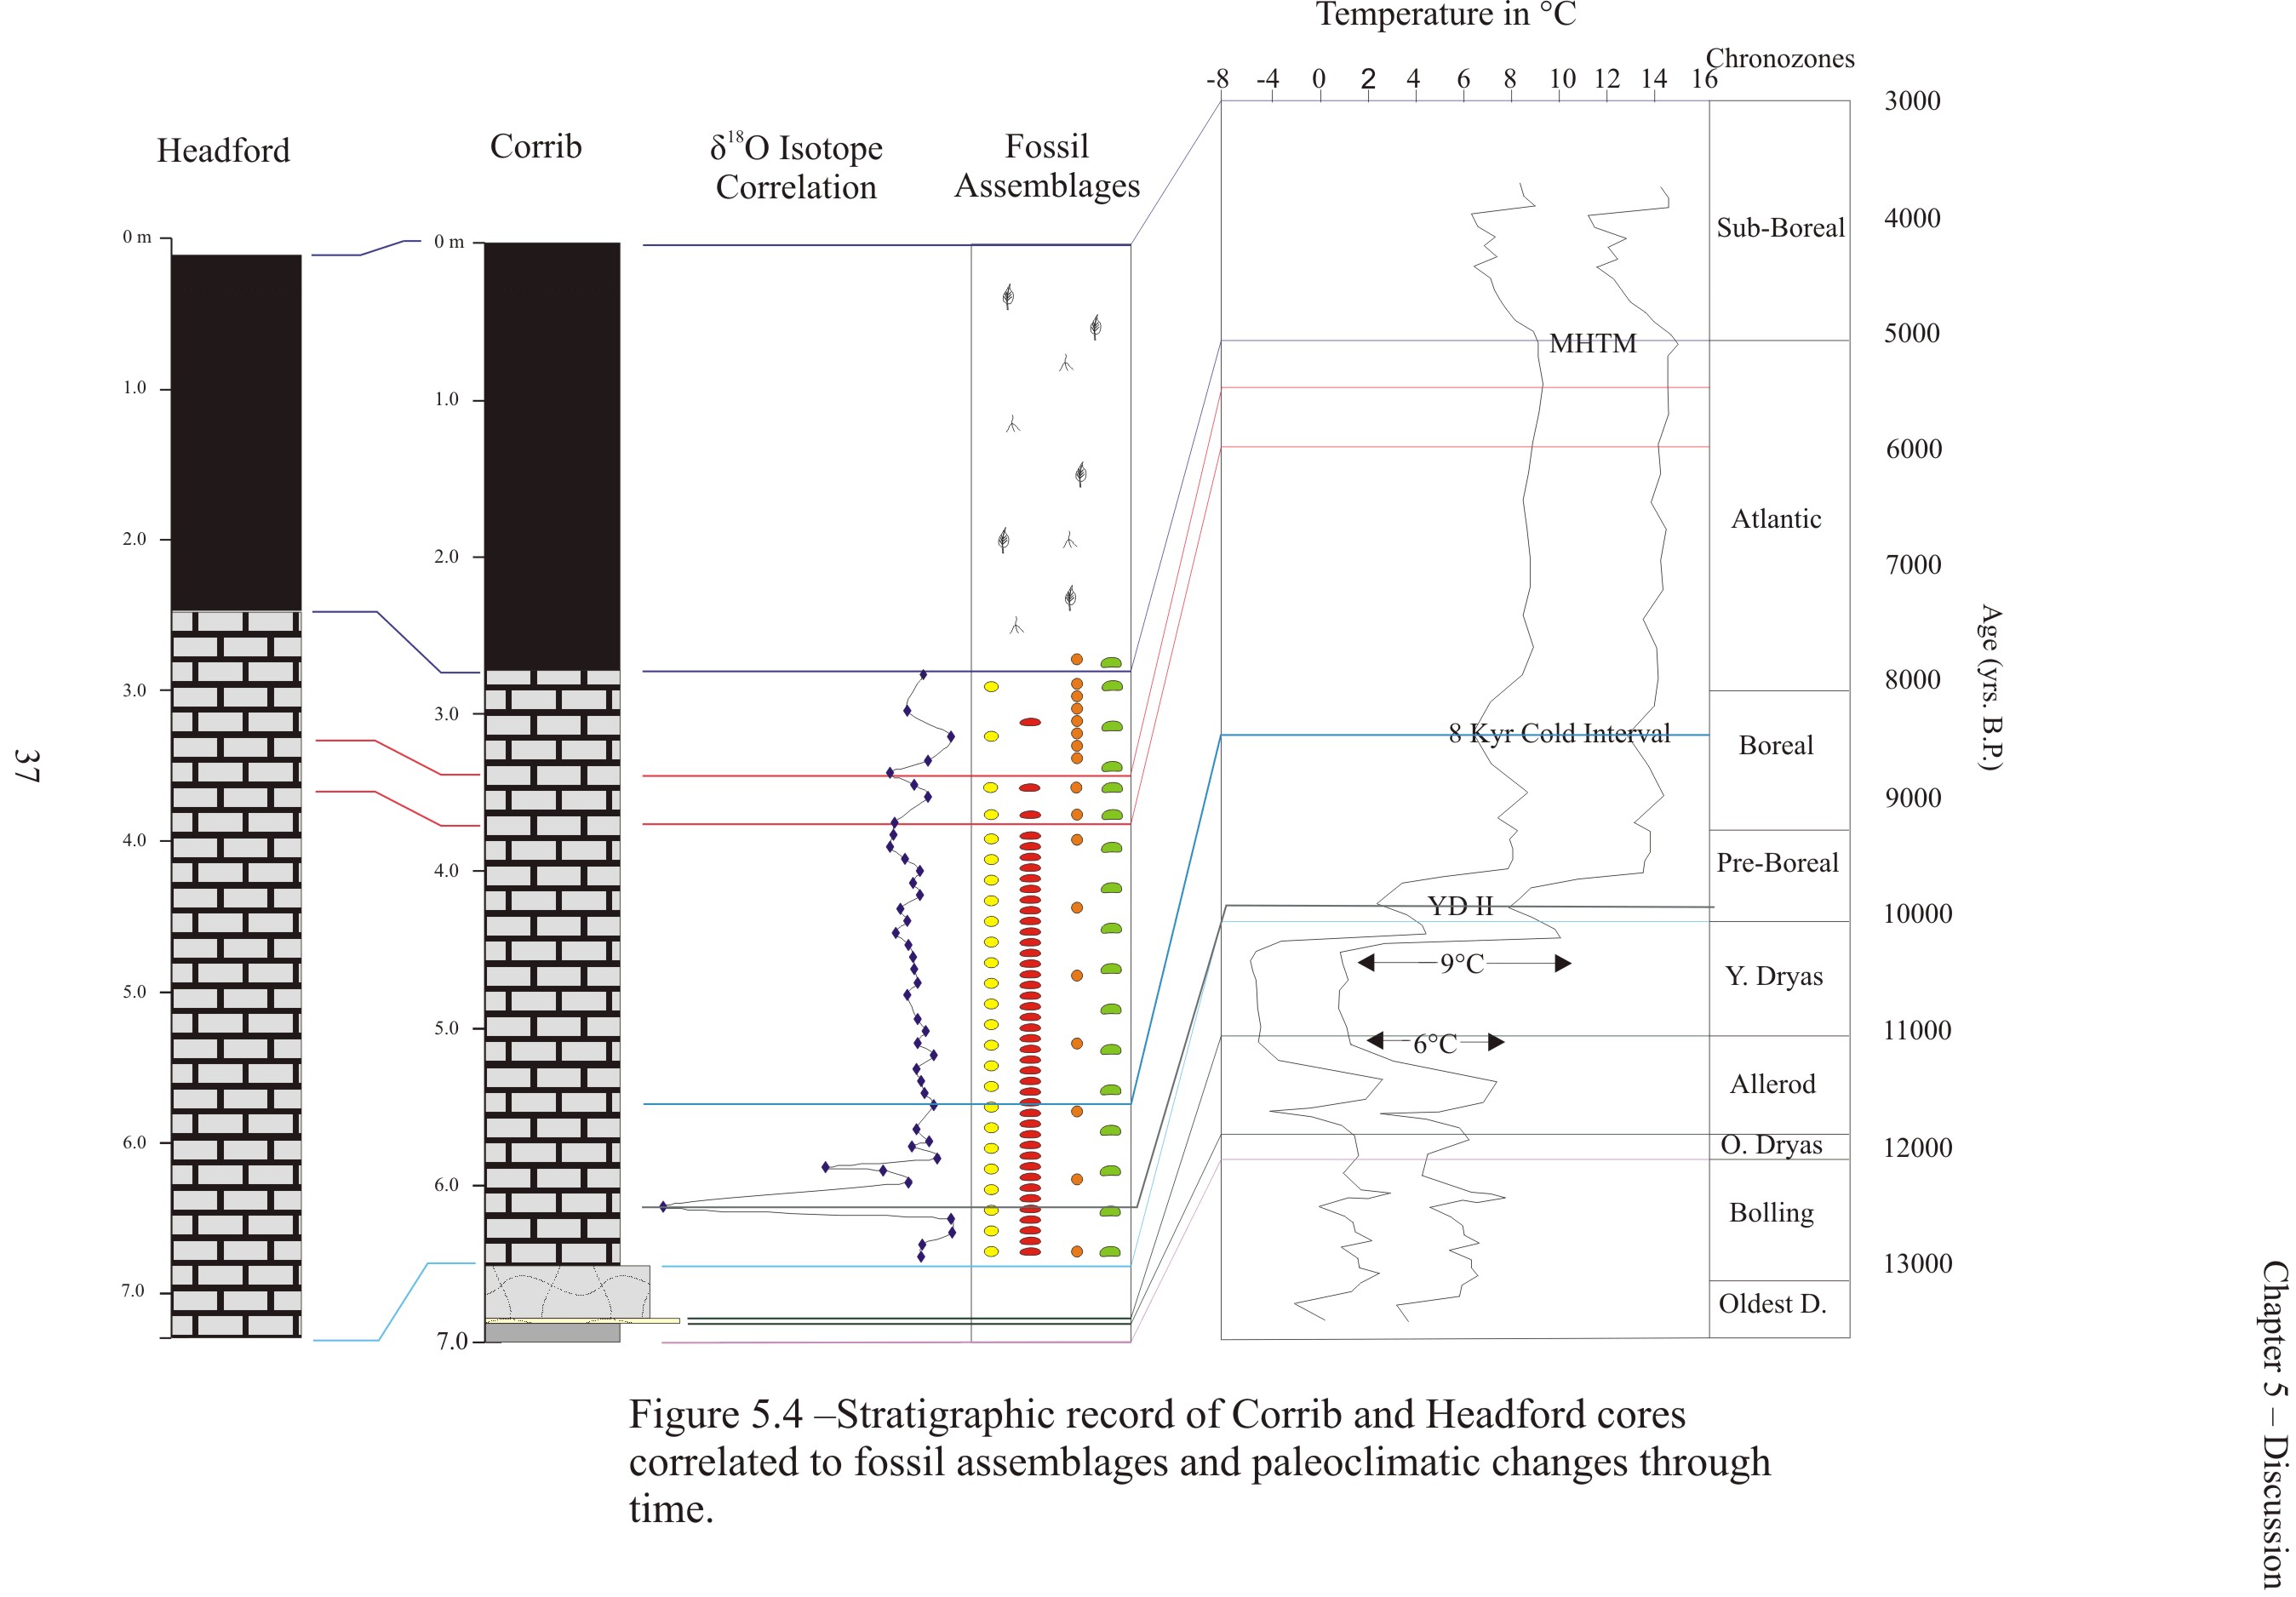
So what did my results show? Let's look at Figure 5a:

On the left hand side are the two computer representations of the lithology of the Hedford and Corrib Cores (Yes, even I misspelled some things in my time). The black is what we call peat or undigested organic materials. The gray brick-like stuff is called marl, a catch all term for excessive calcium carbonate that forms as mud and doesn’t have enough time to suffer lithification (turn to stone). The bottom of Corrib core shows heavy clay (light gray), a layer of gravel (yellow) and super dense, super dark clay (dark gray). The super dense dark layer is often correlated to the Younger Dryas Climate Event. I’ll explain what that is a bit later.
Moving over to the right, we have the isotope data (blue dots connected by a line) and four colored markers representing which ostracodes were found where. Before you ask, I never did put a legend on this document so which ostracodes are where is entirely uncertain. If I published the data set (in press right now) you could figure it out as it was cleaned up.
Furthest to the right is the (at the time) current known deep sea isotopic record (in terms of degrees centigrade) taken from foraminifera, ostracodes and other stuff collected from the bottom of the ocean. The sectors have been labeled with some interesting names, each one being a climate-chron or chronozone (sounds like chromosome, but I swear, it’s not climate DNA). A chron just means time period (short for chronology) and climate means a distinctive pattern of moisture, wind, vegetation, etc.
Using state of the art line technology, I correlated my isotope records to the modern (at the time) climate framework and built a Western Irish Climate Record for the two cores I used. That record is as follows:
12,000 to 10,000 years before the present (hereafter y.b.p). Based on the models, this chronozone is characterized as having colder temperatures with repeated episodes of glacier melt and re-advancement. The single largest glacial re-advancement was given the title of Older Dryas. Therefore, the next largest was called the Younger Dryas. The Younger Dryas is thought to have occurred between 10,000 and 12,000 y.b.p. and is usually used as the beginning of the Holocene Epoch (the time we live in now). The microfossils used in this study require water, so the hard clays and silty clays which are indicative of having little to no water at this time, are fossil poor (or fossil non-existent). The bottom of Corrib Core shows this nicely.
Between 10,000 and 5,000 y.b.p. are characterized by carbonate rich marls, which form in water. As expected, microfossils flourish. Using the species Limnocytherina and Cyclocypridae, we can determine what types of conditions there were. For instance, in my last article, I mentioned that Limnocytherina loved oligotrophic conditions, or clear water condition. Cyclocypridae likes eutrophic conditions or muddy (high organic) waters. There are higher populations of Limnocytherina in the lower marls, suggesting that the waters started out clear, but got muddier over time as populations of Cyclocypridae increased while Limnocytherina decreased. That should be figure two... where is it... ah, figure 5.1 (here labeled 5b).
Ten cent word warning: the process of going from clear waters to murky waters through time is called eutrophication.
Between 5000 y.b.p. and today, the loughs experienced peat formation. Now, just because peat is forming does not mean we don’t get fossils. Much to the contrary. There are millions of the little buggers running around, eating plant material and living full and healthy lives. The problem is, high organic content, such as that found in peat, turns the water slightly acidic (carbonic acid formed as peat degrades). Therefore the calcareous shells don’t last very long.
So how do I know we have peat formation? That was in the core pictures, represented as black zones. Peat is nasty, icky and not something I really ever want to try to sort through for fossils again.
Digression number four. Onto part two!
So the United States Geological Survey (USGS), the North Carolina Geologic Survey (NCGS) and East Carolina University (ECU, more on the backside of the projects) got together and started a five year multi-million dollar research project designed to study the North Carolina Sound System (Albemarle and Pamlico), the barrier islands proper and the inner continental shelf seaward of the islands. Somehow, I ended up with a project on the inner continental shelf.
So, USGS and NCGS personnel stole (not really... more like borrowed) an R/V (research vessel) and tripped up and down the coast, inside and outside of the sounds taking cores (over 200!) and a series of things called geophysical datum (more on that later). Some of the researchers noticed something funny with some of the cores and decided someone needed to investigate what was going on.
So along I came some ten years later. USGS, NCGS and ECU people looked at me and said “We give unto thee these twenty three cores, to research, log, process and write upon as if you wanted to be a Master’s of Geology.” Awed by the voice over, bright lights and the idea of being a Master’s, I readily took the assignment.
First things first... why these cores? Well, the people who gave me the cores noticed that there were sections of compacted mud in these cores. Flipping through some books, I realized that mud should not exist on the inner continental shelf as waves, tides and storms should destroy it all and replace it with sand. By destroy I mean move and by replace I mean bring from shore.
My project became “What are muds doing on the shelf?” Incarnation number one.
Two ideas were brought forth. First, the muds were part of the Pamlico Sound (which was about 5 miles away at best) that got buried by barrier island migration (movement of the islands) and relict (leftover) on the shelf. Second, there was a second river system some thousands of years before the present (6000+) and it was flooded, turned into a sound (like modern day Pamlico) and truncated (cut off) by advancing (rising) sea level.
Whew... never thought I could say all that in two sentences.
My project evolved from “What the...?” to “Paleoenvironmental reconstruction.” Incarnation number two.
Ok, definition time. Paleoclimatology is the study of how the climate has changed based on proxies or data sets that indicate how things have changed. To understand paleoclimatology, one needs to reconstruct the environment because the environment tells you the climate. So for my first project, I used environmental indicators, ostracodes, organic material, isotopes, etc., to identify the environment and therefore infer the climate. In this project, I could not get good climate indicators, but I could reconstruct the environments and see some of the climate shifts.
So, what did I do? Last time it was ostracodes. That wasn’t hard enough, so I went foraminifera this time... which are half the size of ostracodes. So, I processed the critters and sediments and built a pretty picture of what we found.
We found that about 6,000 y.b.p., sea level had not advanced far enough to drown a river system (which would turn it into an estuary, like modern Pamlico Sound). How do we know there was a river there? That’s where the pesky geophysical datum come in.
We used something called sub-surface seismic reflections to map out the shelf area in which my cores (only 23 of 200+, thank the god/s/dess/es). We used the 3d profile to show where relict river channels were. We found a nice long river system east of the modern Pamlico Sound, which is itself a drown river system. So we know the river was there first.
Science Moment, brought to you by TEA, it makes the world go round. In geology we have some basic laws. One of them is the Law of Original Horizontality. This means everything is laid down flat. Of course, not everything is laid down flat, but we make the assumption, so when we find a rock or sediment that is no longer flat, we know something has happened to it. Think of it as the first slice of bread for a peanut butter sandwich. We also have the Law of Superposition. This means, for a sediment layer to be on top of another (like sediment layer B is on top of A... or like peanut butter is on top of bread with another slice of bread on that), the first sediment layer (in this case A, bread slice one) had to be there first. So, for sediments to cover the relict river system, the river system had to be there first. Simple. The third law is the Law of Crosscutting Relationships. This law says, if you cut into something, that something had to already be there. Example: For you to cut through the aforementioned peanut butter sandwich, it had to be there first. If not, your cutting air and I don’t want to be there for that...
Digression number five. Back to my relict river system. So we know the river was there. What happened to it? Well, sea level advanced in a process called transgression. As sea level advanced, the action of the waves decapitated the relict river system, leaving only the deepest channels, where the low energy of no/small waves allowed mud to collect. The system became an estuary, temporarily. Sea level continued to advance and completely covered this relict system, leaving what we found to guide us towards this answer. Figure 5c should be a good example of this. The figure is in original (left) and colored (right) to show the different sections of the river system. The blue is modern sand. The light yellow is the relict river channel and the pink may or may not be part of the yellow stuff. The heavy black lines show bedforms or boundaries. Ignore the rest... it’s complicated.
So, how do I know it was this process and not part of the Pamlico Sound? Well, back to those pesky foraminifera. I pulled every foraminifera I could from my 150+ samples. Thousands of the buggers later...we found groups of them hanging out together. These groups became fossil assemblages. We then went to the record of what foraminifera prefer what conditions and started researching, much like we did the ostracodes.
The foraminiferal record is based off modern foraminiferal distributions. Meaning if foraminifera x is found in normal salt water today, it was likely that way in the past too. For those foraminifera that have gone extinct, we can assume certain characteristics by morphology or body design.
What we found were some assemblages that came from estuarine conditions. We found some that came from normal marine (modern) conditions. We also found some, as always, that could float or exist in either one. So using these assemblages, we designed a model to show (bottom to top) what conditions had to be like for those assemblages to exist. What we got was choice two, a second river system that had flooded like Pamlico is doing now and has since been overrun by normal marine conditions.
It helped that we had a few back door tricks, like Accelerated Mass Spectroscopy Radiocarbon Age Dating (AMS RCAD) and basic carbon/nitrogen isotopic records. However, those are different stories and I believe I have bored you long enough with my scientific babble.


Comments
Add a comment